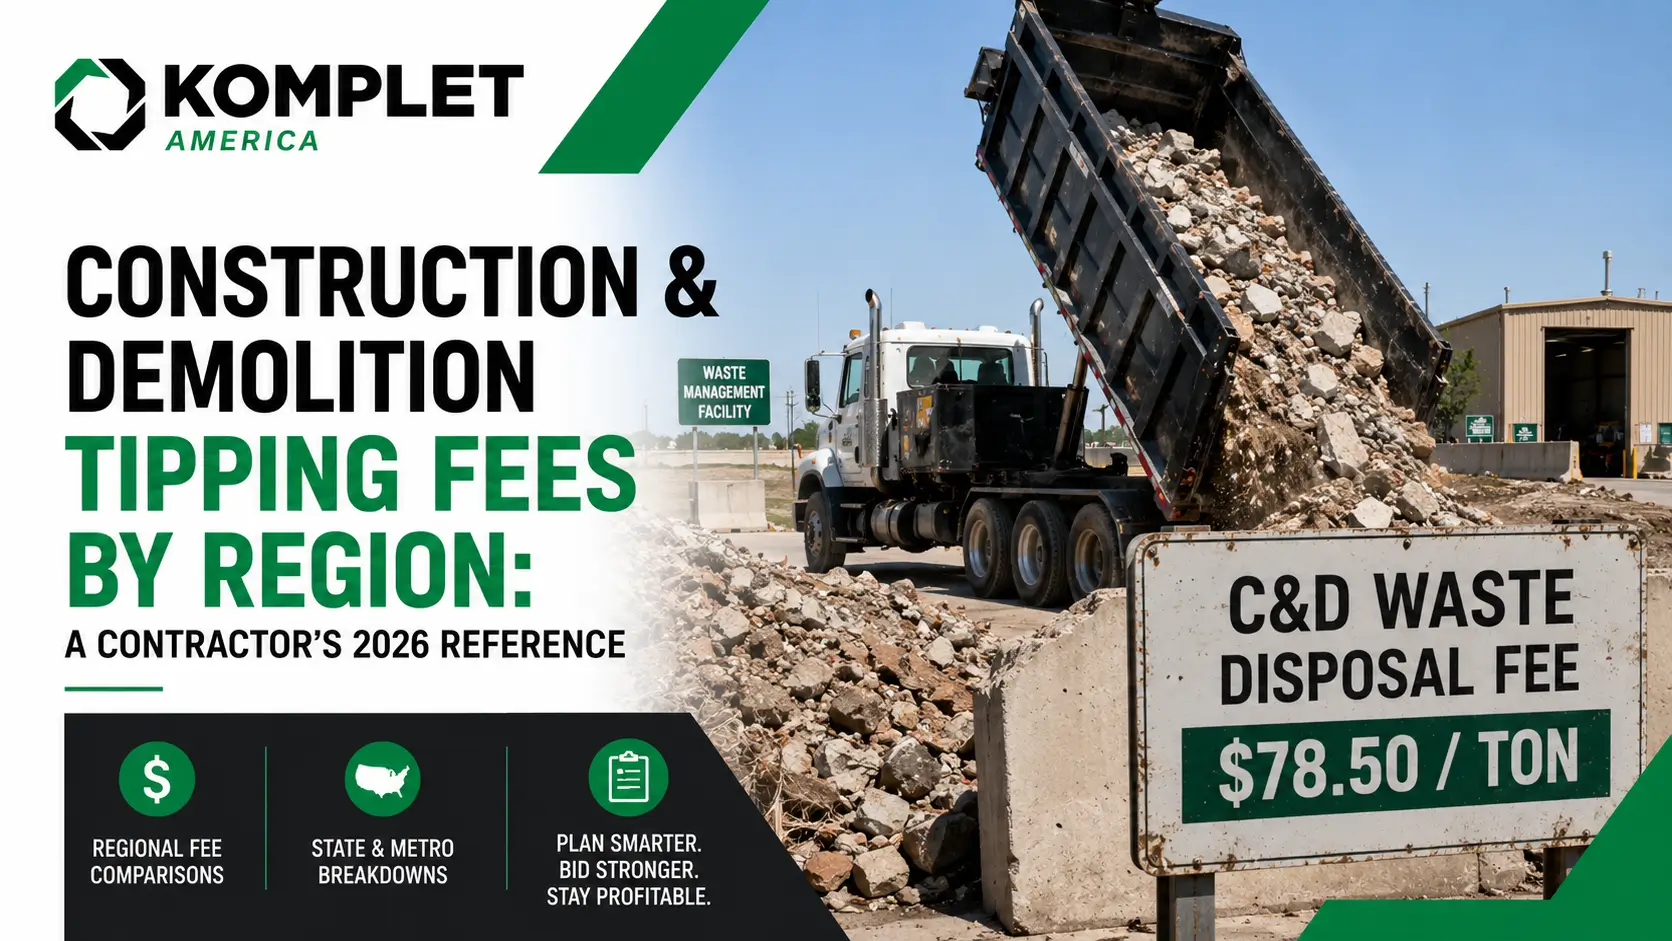

Tipping fees are the silent cost line on almost every demolition, renovation, and site contractor’s bid sheet. They appear as a pass-through expense, paid in cash at the gate, and they have been moving in one direction for the past decade. The Environmental Research & Education Foundation’s 2024 Analysis of Municipal Solid Waste Landfill Tipping Fees — the most comprehensive U.S. tipping fee dataset published — reports a 10 percent national increase in average landfill tipping fees from 2023 to 2024, the largest year-over-year jump since 2022. Construction and demolition (C&D) materials accepted at landfills averaged $65.84 per ton in 2024, slightly above the municipal solid waste average of $62.28 per ton. Regional averages ranged from roughly $45 per ton in the South Central region to over $80 per ton in the Northeast, with individual states reporting averages from under $35 per ton (Mississippi) to over $124 per ton (Alaska).
For contractors who generate concrete demolition rubble, asphalt millings, brick, and mixed C&D as a routine part of doing business, those numbers add up to a real annual cost line. A demolition firm tearing out 50,000 tons of concrete a year in the Northeast pays a different cost line than the same firm doing the same work in Texas or the Mountain West. A hardscape contractor doing residential patio replacements in California is operating under different regulatory mandates than a hardscape contractor doing the same work in North Carolina. And a recycler positioning to supply state DOT projects — anywhere — is competing against virgin aggregate prices that are increasingly being set by the difference between a tipping fee paid and a tipping fee avoided.
This guide is a contractor-focused reference to C&D tipping fees across U.S. regions and major metros, drawing on EREF’s 2024 national data, state environmental agency rate schedules, and metro-area waste system documentation. It also covers the regulatory mandates — mandatory C&D diversion rates, building code recycling requirements, prohibited disposal categories — that increasingly affect what a contractor can dump and what they cannot. And it walks through the on-site crushing math that turns C&D rubble from a paid-out cost line into a stockpile of saleable aggregate, using compact mobile crushing equipment sized for the kind of work most U.S. contractors actually do.
Komplet America has been the U.S. distributor of Komplet S.p.A. compact crushers, screeners, and shredders since 2018, and the Conti family construction legacy behind Komplet America stretches back to 1906. The conversations we have on the phone with prospective customers begin, almost without exception, with the same two numbers: how much C&D rubble do we generate, and what are we paying to dump it. The data below is the broader context for those conversations.
The 2024-2026 National Picture
The starting point for any tipping fee discussion is EREF’s 2024 Analysis of Municipal Solid Waste Landfill Tipping Fees, published in 2025. The dataset is built from a survey of 494 active landfills nationwide, with rate data successfully collected from 351 facilities — the most comprehensive disposal-pricing snapshot of the U.S. landfill system available.
The Headline Numbers
- National average MSW landfill tipping fee: $62.28 per ton (2024), up from $56.80 per ton (2023). Year-over-year increase of approximately 10 percent — the largest single-year jump since 2022.
- National average C&D-accepting landfill tipping fee: $65.84 per ton (2024), only slightly above the MSW average. Roughly 55 percent of surveyed landfills charged identical rates for both waste streams, suggesting that C&D pricing is converging with MSW pricing in many markets.
- Tonnage-weighted national average MSW tipping fee: $62.63 per ton (2024). The weighted figure adjusts for the fact that larger landfills handle more tonnage, providing a different view of “what waste actually costs to dispose of.”
- Inflation-adjusted growth: U.S. landfill disposal costs have grown nearly 30 percent since 2016 in inflation-adjusted terms.
- Statistical drivers: EREF’s regression analysis identified strong correlation between landfill tipping fees and the Consumer Price Index (R² = 0.82 in 2024), with labor costs the dominant input — wages, equipment maintenance, and fuel prices flowing through to gate rates.
The Regional Spread
EREF groups U.S. states into six regions for analysis. Average landfill tipping fees by region, based on the EREF October 2024 survey:
- Northeast: approximately $80.67 per ton (highest in the nation). Some sources report fees as high as $84.44 per ton when including state-specific increases. The Northeast has led the country in average tipping fees for at least a decade, and the gap is widening as remaining landfill capacity contracts.
- Pacific (CA, HI, OR, WA): approximately $72.88 per ton. Pacific fees surged 17 percent in 2024 alone, driven primarily by rising costs in California and Hawaii.
- Mountains/Plains: approximately $58 per ton (mid-range).
- Midwest: approximately $50 per ton.
- Southeast: approximately $48 per ton.
- South Central (AR, LA, NM, OK, TX): approximately $44.87 per ton (lowest in the nation). Has historically been the cheapest region for landfill disposal, though fees here have also been climbing in recent years.
State-Level Extremes
- Highest reported state average: Alaska at $124.25 per ton, reflecting remote operations, limited road infrastructure, and harsh operating conditions.
- Maine: $110.91 per ton.
- New Hampshire: $110.46 per ton.
- Lowest reported state averages: Mississippi at $31.90 per ton, Kansas at $34.78 per ton.
- Most states fall between $45 and $85 per ton.
Public vs. Private Landfills
EREF’s data identifies a 34 percent pricing gap between publicly owned and privately owned landfills:
- Private landfills (about 34 percent of the total surveyed): approximately $74.75 per ton.
- Public landfills: approximately $55.89 per ton.
Private operators handle roughly 62 percent of national MSW tonnage. The pricing gap reflects host-community fees, profit margins, and the absence of tax-revenue subsidies that public facilities can use to lower gate rates.
Waste-to-Energy States
- WTE states: $71.28 per ton (2024 average).
- Non-WTE states: $55.57 per ton (2024 average).
- Premium for landfilling in WTE states: 28 percent. The pattern reflects stricter disposal regulations, higher recycling participation, and reduced supply competition for landfill capacity in WTE-active markets.
Capacity Pressures Ahead
EREF and the Solid Waste Environmental Excellence Protocol have flagged capacity constraints that are likely to drive continued tipping-fee increases through the late 2020s. According to industry estimates, seven U.S. states face landfill capacity exhaustion within five years, with the Northeast projected to lose 30 percent of its remaining landfill capacity in that timeframe. The U.S. could run out of overall landfill capacity in roughly 18 years at current generation rates, and MSW generation is forecast to increase by approximately 50 percent by 2050. The combined picture — rising labor costs, contracting capacity, growing waste volume — points toward continued tipping-fee increases for the foreseeable future. The contractor planning equipment purchases and disposal strategies in 2026 should plan for that trajectory rather than for current numbers holding flat.
Why C&D Specifically — and How It Differs From MSW
Construction and demolition material is its own category in the waste stream, with its own regulatory treatment, its own facility types, and its own pricing dynamics. Understanding the differences matters for any contractor calculating annual disposal costs.
Volume
The U.S. generates over 600 million tons of construction and demolition debris annually — more than twice the volume of municipal solid waste. Concrete and aggregate represent approximately 67.5 percent of total C&D waste by weight. Demolition activities account for about 90 percent of total C&D waste generation; new construction accounts for the remaining 10 percent. Approximately 76 percent of C&D is successfully diverted from landfills nationally, with the diversion rate varying significantly by region and by mandate.
Facilities
- Active landfills accepting C&D — generally available, but increasingly subject to material restrictions (asphalt prohibitions, drywall acceptance limits) in capacity-constrained regions.
- C&D processing and recycling facilities — sort mixed C&D, recover concrete and asphalt for downstream RCA and RAP production, recover metals for scrap, and divert acceptable wood and cardboard. Typically charge tipping fees comparable to or below MSW landfill fees because of the value recovery on the back end.
- Inert debris engineered fill operations (IDEFOs) — accept clean inert material (concrete, brick, asphalt) for use in engineered fill projects. Specifically authorized in California for soil debris from C&D projects under L.A. County’s August 2024 Construction and Demolition Recycle Reuse Ordinance.
- Transfer stations — accept mixed C&D, charge fees often higher than direct landfill rates, and forward material to landfills hundreds of miles away in regions like New York City where no active landfills operate locally.
Pricing Patterns
- Per-ton C&D tipping fees at landfills generally track within $5 to $10 per ton of MSW fees in the same market.
- Mixed C&D processing facilities in California typically charge $90 to $160 per ton, while California landfill fees for the same material run $120 to $200 per ton — the spread is engineered to incentivize recycling diversion.
- Clean concrete (separated from mixed C&D) generally tips at lower rates than mixed C&D, particularly at recycling facilities that produce RCA — clean concrete is the input to a saleable product, not a disposal cost.
- Specialized streams have specific pricing: asphalt shingles, drywall, and treated wood often face higher fees or outright disposal bans in capacity-constrained states.
Regional Deep-Dive: The Six U.S. Regions
Northeast (Highest-Cost Region)
Northeast states — including New York, New Jersey, Connecticut, Massachusetts, New Hampshire, Maine, and Rhode Island — report the highest average landfill tipping fees in the country at approximately $80.67 per ton (2024 EREF data). The Northeast has held this position for at least a decade, and the gap is widening as remaining landfill capacity in the region continues to contract.
Drivers:
- Limited remaining landfill capacity. The Northeast is projected to lose 30 percent of its remaining capacity over the next five years.
- Active waste-to-energy infrastructure in Connecticut, Massachusetts, New Hampshire, Maine, and parts of New York that competes with landfills for waste streams.
- Higher operating costs — labor, regulatory compliance, host community fees, and post-closure liabilities all higher than the national average.
- State-level surcharges. New Jersey applies a $3 per ton Recycling Enhancement Act (REA) recycling tax to all disposal fees. Several other Northeast states apply similar surcharges.
Representative data points:
- Sullivan County, NY: $120 per ton for both MSW and C&D as of late 2024, with rates increased to $150 per ton effective January 1, 2025 (an interim $136.50 per ton MSW rate from January through June 2025).
- Morris County, NJ (MCMUA Transfer Stations): $113 per ton for Type 10 waste in 2026, including the $3 per ton NJ REA recycling tax and approximately $5.08 per ton in host community benefits.
- New York City: no active landfills within the five boroughs. C&D debris travels by truck to landfills hundreds of miles away when transfer station fees plus transportation cost combine to be cheaper than alternative disposal. Transfer station fees historically reported in the $60 to $80 per ton range, with continued upward pressure.
Pacific Region
Pacific states — California, Hawaii, Oregon, and Washington — report the second-highest regional average at approximately $72.88 per ton (2024). Fees in this region surged 17 percent in 2024, driven primarily by rising costs in California and Hawaii. California in particular has the strictest C&D recycling regulations in the country, which compounds the cost picture for contractors who do not separate or recycle on-site.
Drivers:
- Aggressive state-level recycling mandates. California’s CALGreen building code requires C&D recycling plans for projects over $50,000. Statewide mandate of 65 percent C&D debris diversion (some cities require 75 to 100 percent).
- Permit-driven facility constraints. California operates approximately 190 active landfills, down from over 600 in the 1990s due to closure programs.
- Mandatory third-party verification of recycling rates at some recycling facilities (San Francisco Environment Department Regulation #SFE-24-01-CDO, adopted May 2024).
- Hawaii’s geographic isolation creates Alaska-like cost pressures.
Representative data points:
- Los Angeles County: As of August 19, 2024, the updated Construction and Demolition Recycle Reuse Ordinance increased the mandatory recycling rate for mixed C&D from 50 to 70 percent, increased the rate for soil debris from 50 to 100 percent, and added third-party certification requirements for recycling facilities. Mixed C&D processing facility fees in California: $90 to $160 per ton. Landfill fees for the same material: $120 to $200 per ton.
- Los Angeles City: All mixed C&D waste generated within city limits must be taken to City-certified C&D waste processors under the Citywide C&D Waste Recycling Ordinance. Haulers and contractors must obtain a Private Waste Hauler Permit from LA Sanitation (LASAN) before collecting or transporting C&D waste.
Mountains/Plains Region
Mountains/Plains states — including Colorado, Idaho, Iowa, Kansas, Minnesota, Missouri, Montana, Nebraska, North Dakota, South Dakota, Utah, and Wyoming — report regional average tipping fees in the mid-range, generally around $58 per ton. The wide geographic dispersion within the region produces significant state-by-state variation, with population-dense Front Range Colorado markets reporting higher fees than rural plains markets.
- Kansas: $34.78 per ton state average — among the lowest in the country, reflecting abundant landfill capacity.
- Colorado Front Range: higher rates driven by population density and proximity to capacity-constrained Denver metro waste system.
- Generally lower regulatory burden on C&D recycling than Pacific or Northeast regions.
Midwest
Midwest states — Illinois, Indiana, Michigan, Ohio, Wisconsin — report regional averages around $50 per ton. The Midwest combines moderate landfill capacity with active manufacturing and infrastructure markets, producing substantial C&D waste volumes that flow primarily to in-state landfills.
- Chicago metro: higher rates driven by capacity constraints and population density, but substantially below Northeast metro pricing.
- Detroit and southeastern Michigan: moderate rates with active C&D recycling infrastructure tied to Michigan’s automotive demolition and renovation activity.
Southeast
Southeast states — Florida, Georgia, North Carolina, South Carolina, Alabama, Tennessee, Mississippi, Kentucky, Virginia, West Virginia — report regional averages around $48 per ton. Florida is an outlier upward driven by infrastructure activity and constrained landfill capacity in coastal markets.
- Mississippi: $31.90 per ton state average — among the lowest in the country.
- Florida: state average closer to the national average ($60+ per ton), with metro markets like Miami and Orlando reporting rates well above the state average.
- FDOT-driven C&D recycling acceptance creates incentive structures for RCA production statewide. See our companion piece, State DOT Specs for Recycled Concrete Aggregate: A Contractor’s Reference.
South Central (Lowest-Cost Region)
South Central states — Arkansas, Louisiana, New Mexico, Oklahoma, and Texas — report the lowest regional average tipping fees in the country at approximately $44.87 per ton. The combination of abundant landfill capacity, lower labor costs, and less stringent regulatory mandates produces consistently lower disposal costs across the region. Note that South Central tipping fees have been climbing in recent years, narrowing the gap with the national average.
- Texas: state average among the lowest in the country, with TxDOT actively accepting recycled concrete (Type D flexible base) under Item 247 — creating a stable downstream market for C&D recyclers.
- Oklahoma: low state average for traditional waste streams, though the state reported the highest U.S. tipping fee for solar panels ($125 per ton) in EREF’s 2024 specialty waste analysis — illustrating how specific waste categories can deviate sharply from the regional baseline.
Major Metro Deep-Dives
Regional averages mask substantial within-region variation. The data points below cover five major metros where contractor-relevant cost lines differ sharply from regional or state averages.
New York City
- No active landfills within the five boroughs. All C&D debris is hauled to transfer stations and forwarded by truck to landfills in upstate New York, Pennsylvania, Ohio, and beyond.
- Transfer station fees historically reported in the $60 to $80 per ton range; current rates trending upward as transportation costs to receiving landfills increase.
- All private waste haulers regulated by the NYC Business Integrity Commission (BIC), which sets maximum rates for putrescible and recyclable waste — though notably, BIC does not set maximum rates for C&D debris specifically.
- Approximately 60 percent of NYC’s solid waste stream consists of C&D materials (NYC Department of Sanitation data).
- State legislation introduced repeatedly in Albany would mandate 50 percent C&D recycling for contractors in cities with populations over one million — has been carried forward in successive sessions but not yet passed as of late 2025.
Los Angeles County
- As of August 19, 2024, the LA County Construction and Demolition Recycle Reuse Ordinance requires 70 percent recycling for mixed C&D and 100 percent recycling for soil debris.
- Third-party certification of recycling rates required at processing facilities.
- Upfront deposit payment required, refunded once compliance is confirmed during Final Compliance Report (FCR) review.
- LA City separately mandates that all mixed C&D waste generated within city limits be taken to City-certified C&D waste processors under the Citywide C&D Waste Recycling Ordinance.
- Mixed C&D processing facility fees: $90 to $160 per ton; landfill fees for the same material: $120 to $200 per ton.
San Francisco Bay Area
- San Francisco Ordinance No. 144-21 (effective January 1, 2022) updated Environment Code Chapter 14 and Public Works Code Section 725 with C&D recovery requirements for transporters, processing facilities, and projects.
- San Francisco Environment Department Regulation #SFE-24-01-CDO, adopted May 22, 2024, governs enforcement of the C&D Debris Recovery Ordinance.
- Third-party verification required for facilities to become Registered Facilities and maintain registration.
- San Francisco’s reported diversion rate of 80 percent has been a national benchmark for C&D recycling, though the methodology and definitions used in calculating this rate have been the subject of academic debate.
Boston / Greater Boston
- Massachusetts maintains landfill bans on certain C&D waste streams, including asphalt pavement, brick, concrete, metal, clean wood, and asphalt shingles — diverting these materials to processing facilities.
- MA disposal bans drive higher per-ton costs at remaining accepting landfills and create steady demand for C&D processors.
- Northeast regional pricing applies — generally above $80 per ton for accepted material at landfills, with C&D processing facilities pricing competitively against landfill fees.
Chicago / Greater Chicago
- Illinois state-level fees moderate compared to the Northeast, but Cook County and adjoining suburban metro markets price closer to the national average than to state averages elsewhere in Illinois.
- Active C&D recycling infrastructure in metro Chicago supports steady RCA and RAP production, including for IDOT-spec base course applications.
The Regulatory Drivers Behind Rising C&D Costs
Tipping fees are not just a function of supply, demand, and operating costs. State and municipal mandates increasingly determine where C&D material can go, what percentage must be diverted from landfills, and what documentation must accompany every load. The contractor unaware of the local mandate is the contractor with a rejected load and a project delay.
Mandatory C&D Recycling Rates
- California: 65 percent statewide C&D diversion mandate via CALGreen building code for projects over $50,000. Some cities (Los Angeles County) require 70 percent for mixed C&D and 100 percent for soil debris. Some cities require 75 to 100 percent overall.
- New York: legislation has been repeatedly introduced to mandate 50 percent C&D recycling for contractors in cities with populations over one million (i.e., New York City). Has not yet passed as of late 2025.
- LEED-certified projects: typically require 50 to 75 percent C&D diversion regardless of jurisdiction, driving documentation requirements.
Material-Specific Disposal Bans
- Massachusetts: state-level bans on asphalt pavement, brick, concrete, metal, clean wood, and asphalt shingles in landfills.
- Connecticut: capacity constraints have driven near-bans on C&D-only landfilling in some markets, with material increasingly directed to processors and out-of-state landfills.
- Specific metro and county-level bans on drywall, treated wood, and roofing materials in capacity-constrained markets across the country.
Documentation Requirements
- California: contractors must submit waste management plans and final diversion reports to building departments under CALGreen. LEED projects require additional documentation.
- Federal E-Manifest system: became mandatory for Small Quantity Generators (SQGs) and Large Quantity Generators (LQGs) on January 22, 2025, requiring digital tracking of all hazardous material shipments. Most C&D is non-hazardous, but lead-painted demolition material, asbestos-containing material, and contaminated soil all fall under E-Manifest requirements.
- OSHA 40 CFR Part 61, Subpart M (NESHAP for asbestos): requires 10-day advance notification for all regulated demolitions.
Producer-Side Documentation
Recyclers and contractors selling C&D-derived RCA into state DOT projects also face increasing documentation burdens. State DOTs require source documentation, stockpile approval, certified producer status, and gradation testing — covered in detail in our companion article, State DOT Specs for Recycled Concrete Aggregate: A Contractor’s Reference.
The On-Site Crushing Alternative: When the Math Works
Rising tipping fees, mandatory recycling mandates, and contracting landfill capacity all push in the same direction: producing C&D rubble back into saleable or usable aggregate, on-site or in-yard, has become the lower-cost path for an increasing share of contractor work. Compact mobile crushing equipment — sized for the volume a typical demolition contractor, hardscape contractor, or recycler handles — closes the gap between dump-and-pay and crush-and-stockpile.
The Two Cost Lines Hit Simultaneously
On-site crushing affects two cost lines simultaneously: the dump fee on rubble being eliminated, and the aggregate purchase being avoided when the same material is reused as base, fill, drainage stone, or saleable product. The contractor producing crushed material from concrete demolition rubble and using it as paver base, retaining wall backfill, or roadway sub-base is, in effect, getting paid twice for the same load of concrete — once because they did not dump it, once because they did not have to buy aggregate.
The math is most favorable in the highest-cost regions. A demolition contractor in the Northeast paying $80 to $150 per ton in dump fees, plus the trucking time and fuel to reach a transfer station, breaks even on the equipment investment substantially faster than the same operation in a low-fee market where the dump fee is $35 to $45 per ton. Pacific Region contractors operating under California’s mandatory diversion rates have an additional incentive: failing to meet the 65 percent diversion threshold creates compliance liability beyond the disposal cost itself.
Equipment Sized to the Operation
The right machine for an on-site C&D crushing operation depends on annual tonnage, the largest piece of feed material the operation routinely encounters, and whether the producer is generating material for in-house use, for resale, or for state DOT supply.
- Small operations (under ~5,000 tons/year of demolition rubble): the K-JC 503 mini mobile jaw crusher — 19-inch by 12-inch jaw, up to 34 US tph, towable behind a standard truck. The starter machine for hardscape contractors, small demolition operations, and pool builders adding on-site crushing for the first time. See our companion piece, The Hardscape Contractor’s Guide to On-Site Stone Production, for the full case for this configuration.
- Medium operations (5,000 to 25,000 tons/year): the K-JC 604 mobile jaw crusher — 23-inch by 16-inch jaw, up to 55 US tph, with integrated hydraulic magnetic belt for rebar separation. The right machine for higher-volume hardscape contractors, smaller demolition firms, and small in-yard recyclers.
- Larger operations (25,000+ tons/year): the K-JC 704 PLUS portable jaw crusher — 27-inch by 16-inch jaw, up to 90 US tph. Komplet America’s best-selling jaw crusher, the workhorse for civil, road, demolition, and recycling work. The K-JC 805 steps up to 31-inch by 21-inch jaw and up to 160 US tph for larger recycling yards and small-quarry operations.
- Cubical aggregate / DOT-spec production: the K-IC 70 compact impact crusher produces a more cubical product than a jaw alone, suited to RCA production for state DOT base course and ready-mix coarse aggregate applications.
- Sizing the output: a Kompatto vibrating screener pairs with the primary crusher to produce sized products (#57, #67, #8, stone dust) sellable as separate streams. For the full breakdown of crushed stone grades, see Crushed Stone Grades: A Komplet Basic Guide to Aggregate Size and Use Cases.
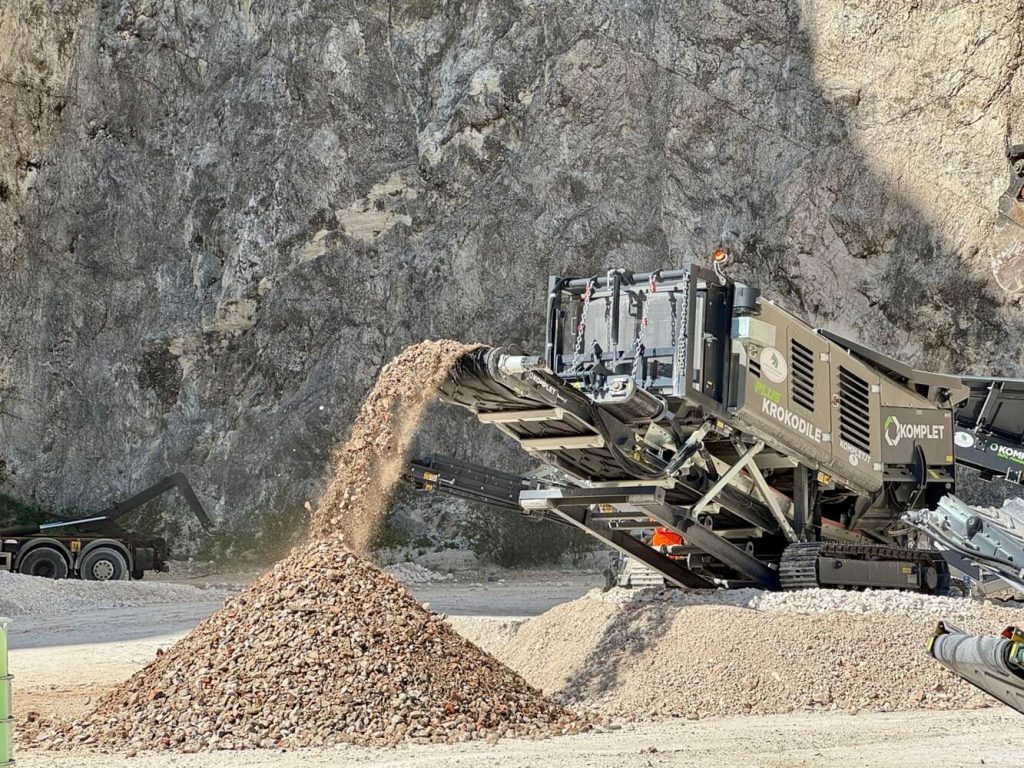
- Pre-reduction of oversized rubble: the Krokodile PLUS slow-speed shredder handles slabs and oversized rubble that exceed the jaw inlet, pre-reducing material to a feed size compatible with the primary crusher.
The Rough Math
Specific payback timing varies dramatically by region, project mix, and operation discipline — there is no universal answer, and any contractor running serious numbers should work with a Komplet specialist to model their specific case. As a directional reference:
- A hardscape or demolition operation in a Northeast metro market generating 3,000 to 5,000 tons of C&D rubble annually at $80+ per ton dump fees can frequently justify a K-JC 503 in 18 to 36 months on dump fee savings alone, before counting any aggregate cost avoidance or aggregate sales revenue.
- The same operation in a low-fee region (Southeast or South Central) typically requires either higher tonnage (10,000+ tons/year) or material reuse / resale revenue to make the same payback case in the same timeframe.
- Higher-volume operations (15,000+ tons/year) running a K-JC 604 or K-JC 704 PLUS plus a Kompatto screener generally see meaningfully shorter payback periods, especially when sized aggregate sales to other contractors are part of the business plan.
- Pre-owned equipment — typically 40 to 70 percent capital savings versus new — substantially shortens payback for any operation profile, and is the most common entry point for first-time buyers.
Frequently Asked Questions
What is the average tipping fee for C&D in the United States?
The Environmental Research & Education Foundation’s 2024 Analysis reports a national average tipping fee of $65.84 per ton for landfills accepting C&D material — slightly above the $62.28 per ton MSW average. About 55 percent of surveyed landfills charge identical rates for both waste streams. Regional and metro variation is substantial: Northeast averages exceed $80 per ton, while South Central averages run under $45 per ton.
How much have tipping fees increased recently?
EREF reports a 10 percent increase in average U.S. landfill tipping fees from 2023 to 2024 — the largest single-year jump since 2022. Inflation-adjusted growth has been roughly 30 percent since 2016. The dominant driver is labor cost (R² = 0.82 correlation with the Consumer Price Index in 2024).
Which U.S. region has the highest C&D tipping fees?
The Northeast — averaging approximately $80.67 per ton in 2024 EREF data, with state-specific increases pushing some metros higher. The Northeast has led the country in tipping fees for at least a decade and is projected to lose 30 percent of its remaining landfill capacity over the next five years, suggesting continued upward pressure.
Which region is the cheapest for C&D disposal?
South Central states — Arkansas, Louisiana, New Mexico, Oklahoma, and Texas — average approximately $44.87 per ton, the lowest in the country. South Central fees have been climbing in recent years, narrowing the gap with the national average.
Where are C&D disposal regulations strictest?
California has the strictest framework: a 65 percent statewide diversion mandate, CALGreen building code requirements for projects over $50,000, and city/county overlays like LA County’s 70 percent mixed-C&D and 100 percent soil-debris recycling requirements (effective August 2024). Massachusetts maintains state-level disposal bans on asphalt, concrete, brick, metal, clean wood, and asphalt shingles. New York legislation has repeatedly introduced 50 percent C&D recycling mandates for cities over one million population.
How does an on-site crusher pay for itself?
On-site crushing eliminates the dump fee on rubble that would otherwise be paid, and provides the input for aggregate that would otherwise be purchased. In high-tipping-fee regions like the Northeast and Pacific, the combined savings frequently justify a K-JC 503 or K-JC 604 in 18 to 36 months for hardscape and demolition operations generating moderate annual tonnage. In low-fee regions, the math typically requires higher tonnage or aggregate resale revenue. Specific payback varies by region, operation, and discipline.
Are C&D tipping fees expected to keep rising?
Industry forecasts point to continued upward pressure: contracting landfill capacity (seven states facing exhaustion within five years), rising labor and equipment costs, and projected 50 percent increase in MSW generation by 2050. EREF’s regression analysis shows tipping fees correlating strongly with the Consumer Price Index, meaning general inflation flows directly through to gate rates. Contractors planning equipment purchases in 2026 should plan for that trajectory rather than for current numbers holding flat.
What happens to C&D after it’s tipped?
Depends on the facility. Approximately 76 percent of U.S. C&D is diverted from landfills nationally — much of that volume processed back into recycled concrete aggregate (RCA), reclaimed asphalt pavement (RAP), recovered metals, and salvageable wood. The remaining tonnage is landfilled, used as alternate daily cover at landfills (which is sometimes counted as recycling under specific state definitions), or processed at transfer stations and shipped to distant landfills. Concrete and aggregate represent approximately 67.5 percent of total C&D waste by weight, making concrete recycling the single largest C&D recovery stream.
Final Thoughts
Tipping fees are a structural cost line on the U.S. construction industry, and the structure is moving in one direction. The contractor planning equipment purchases, demolition projects, and recycling operations in 2026 should plan based on the EREF 2024 data and the trajectory it implies — not on the lower numbers from 2018 or even 2022. The contractor running an operation in the Northeast or Pacific region should plan for fees that have already passed the national average and that show no sign of stabilizing.
The on-site crushing alternative is no longer experimental, no longer reserved for high-volume highway and quarry work, and no longer dependent on subsidies or special pricing to make the math work. Compact mobile crushing equipment — the K-JC 503, K-JC 604, K-JC 704 PLUS, K-JC 805, K-IC 70 — is sized for the kind of work most U.S. contractors actually do, and the case for owning the equipment is strongest in exactly the markets where dump fees are highest and most regulated. The pattern that first showed up in California and the Northeast a decade ago is now spreading nationally as the underlying landfill capacity contracts.
None of this means every contractor should buy a crusher tomorrow. Some operations are not the right scale for on-site production. Some regions are not yet at the price points where the math closes. Some specific work mixes — light interior demolition, drywall renovation, mixed C&D with low concrete content — do not generate the right kind of feed material. But for the operation that does generate clean concrete demolition rubble, that is paying real dump fees, and that is also buying real aggregate, the math has shifted from “interesting” to “hard to argue against” in the past several years. We expect that trend to continue.
For the contractor-side perspective on producing crushed stone for paver base, drainage stone, and bedding aggregate from C&D rubble on-site, see The Hardscape Contractor’s Guide to On-Site Stone Production. For the full breakdown of crushed stone grades and gradations referenced throughout this article, see Crushed Stone Grades: A Komplet Basic Guide to Aggregate Size and Use Cases. For the producer-side reference on supplying recycled concrete aggregate into state DOT projects, see State DOT Specs for Recycled Concrete Aggregate: A Contractor’s Reference.
Ready to Run the Numbers on Your Operation?
- Talk to a Komplet specialist about pairing the right crusher and screener to your annual rubble tonnage, regional fee environment, and project mix. Call 908-369-3340 or visit com/contact-us.
- Browse the full Komplet equipment lineup — crushers, impact crushers, screeners, conveyors, and shredders sized for compact, on-site, and in-yard recycling.
- Explore equipment financing through Komplet Capital — 24-hour approvals, terms from 36 to 72 months, 100% financing available.
- Consider a pre-owned Komplet machine — typical capital savings of 40 to 70 percent versus new, factory-supported by the same Komplet America service network.
Never enough.
Disclaimer: All tipping fee figures, regional averages, and statistical data in this article are drawn from publicly available sources current as of late 2025 and early 2026, including the Environmental Research & Education Foundation’s 2024 Analysis of Municipal Solid Waste Landfill Tipping Fees, state and county environmental agency rate schedules, and metro-area waste system documentation. Tipping fees change frequently — the specific gate rate at any landfill, transfer station, or processing facility on any specific date should be confirmed directly with the facility before bidding or budgeting. Regulatory mandates and disposal restrictions also change. Always confirm current requirements with the relevant state or local environmental agency before launching a recycling operation or bidding a project. ROI, payback, dump fee, and revenue figures in this article are illustrative ranges based on typical regional pricing patterns. Actual results vary significantly by region, market, project specifications, equipment utilization, operator skill, financing terms, regulatory environment, and many other factors. Operating, maintenance, and service guidance is general in nature. Always refer to the official Komplet operator’s manual for the specific machine model and serial number, and follow OEM intervals and procedures. For warranty-protected work, contact Komplet America at 908-369-3340 or your authorized Komplet dealer. Improper service or non-OEM parts may void warranty coverage and create safety hazards.